


Bubble Shinrin-yoku
Can you catch one before they pop?

Curious Minds… Why is there no “logorrhea” for the mind?
Culture is all around us. Every culture on this planet has aspects that can brighten a day, make you smile.
One of my favorite cultural nuggets are the vast amount of words that exist and how some cultures have words for concepts that don’t exist in English. For example, a super fun word from the Japanese language is Shinrin-yoku. This translates roughly as a “forest bath”. Walking through a forest purely for its restorative benefits.
That is absolutely fantastic! The idea of a daily forest bath intrigues me to no end. Imagine paying nine dollars for a shinrin-yoku bomb at REI… when you get to a forest and unwrap, it turns into a bunch of bubbles!
Bubble Shinrin-yoku…is there a business idea there…
Anyway, I bring up shinrin-yoku not only because it is a kick ass word but because with so many words out there, I’ve never found a word for the jumble of ideas floating around my headspace. I need some mind Logorrhea!
For context, “logorrhea” is a term for excessive wordiness and repetitiveness, commonly associated with a communication disorder. Imagine a jumbled mess of words.
I want a word like this but for the mind. The Japanese and German languages are typically my go to for words representing complex ideas but I have yet to find anything. So I am suggesting the following:
Logorrhea’s etymology is Greek, namely Logos meaning “word” and Rhea meaning “flow”. Ergo (another Greek word) I suggest the follow possible words.
Nousrrhea (Nous - Greek for intellect or intelligence)
Phrenrrhea (Phren - Greeek for location of thought)
Dianoiarrhea (Dianoia - Greek for thinking, used a lot by Plato)
Selfishly Dianoiarrhea seems like a good bet as it checks several boxes. It would loosely translate to “thinking flow”. It maintains the etymology characteristics of logorrhea. Finally, it fulfills my inner 6 year old self as it sounds a lot like diarrhea which is tangent to toilet humor.
Let me know if one of those speaks to you…
Lies, Damned Lies & Statistics
Correlation. Causality.
Both start with the letter “C”. Both have 4 syllables. Often treated as synonyms by politicians, marketing companies, media companies, and others.
Unfortunately, conflating these two words is quite real and quite active. When crafting a data story, it is easy to fall into this trap… letting correlation equal causation.
Don’t fall into this trap. Understanding the differences will help you make more informed opinions about everyday topics.
So how do we avoid falling into the trap? First, imagine Thing A and Thing B. They are correlated… this could mean:
They are completely unrelated
Thing A can be the cause of Thing B
Thing B can be the cause of Thing A
Thing C can affect both Thing A and Thing B but you don’t know about Thing C
The idea that two things can have a statistical relationship but not actually have a relationship can be confusing. It’s natural to want to infer options 2 or 3; causality is simple. Simple ideas make for great stores.
Let’s tell a fun story demonstrating this point.
Have you heard about the frightening epidemic plaguing the United States. Yes, I am talking about Bed Sheet Tangliation; the death of persons who have become tangled in their bed sheets.
Over a 10 year time span, Bed Sheet Tangliation has grown by over 100%. At this rate, some models have calculated over 1000% increase by 2100.
Until now, we have only speculated about this rising tide but it is clear now beyond a shadow of a doubt the cause….
Cheese Consumption.
Cheese consumption per capita more tightly correlates with bed sheet tangliation than any other factor we have at our disposal. Its clear that this epidemic can only be stopped through aggressive regulatory and legislative policy tightly controlling per capita cheese consumption.
Look at this fancy chart. PROOF! A correlation (R value) of 94.71%
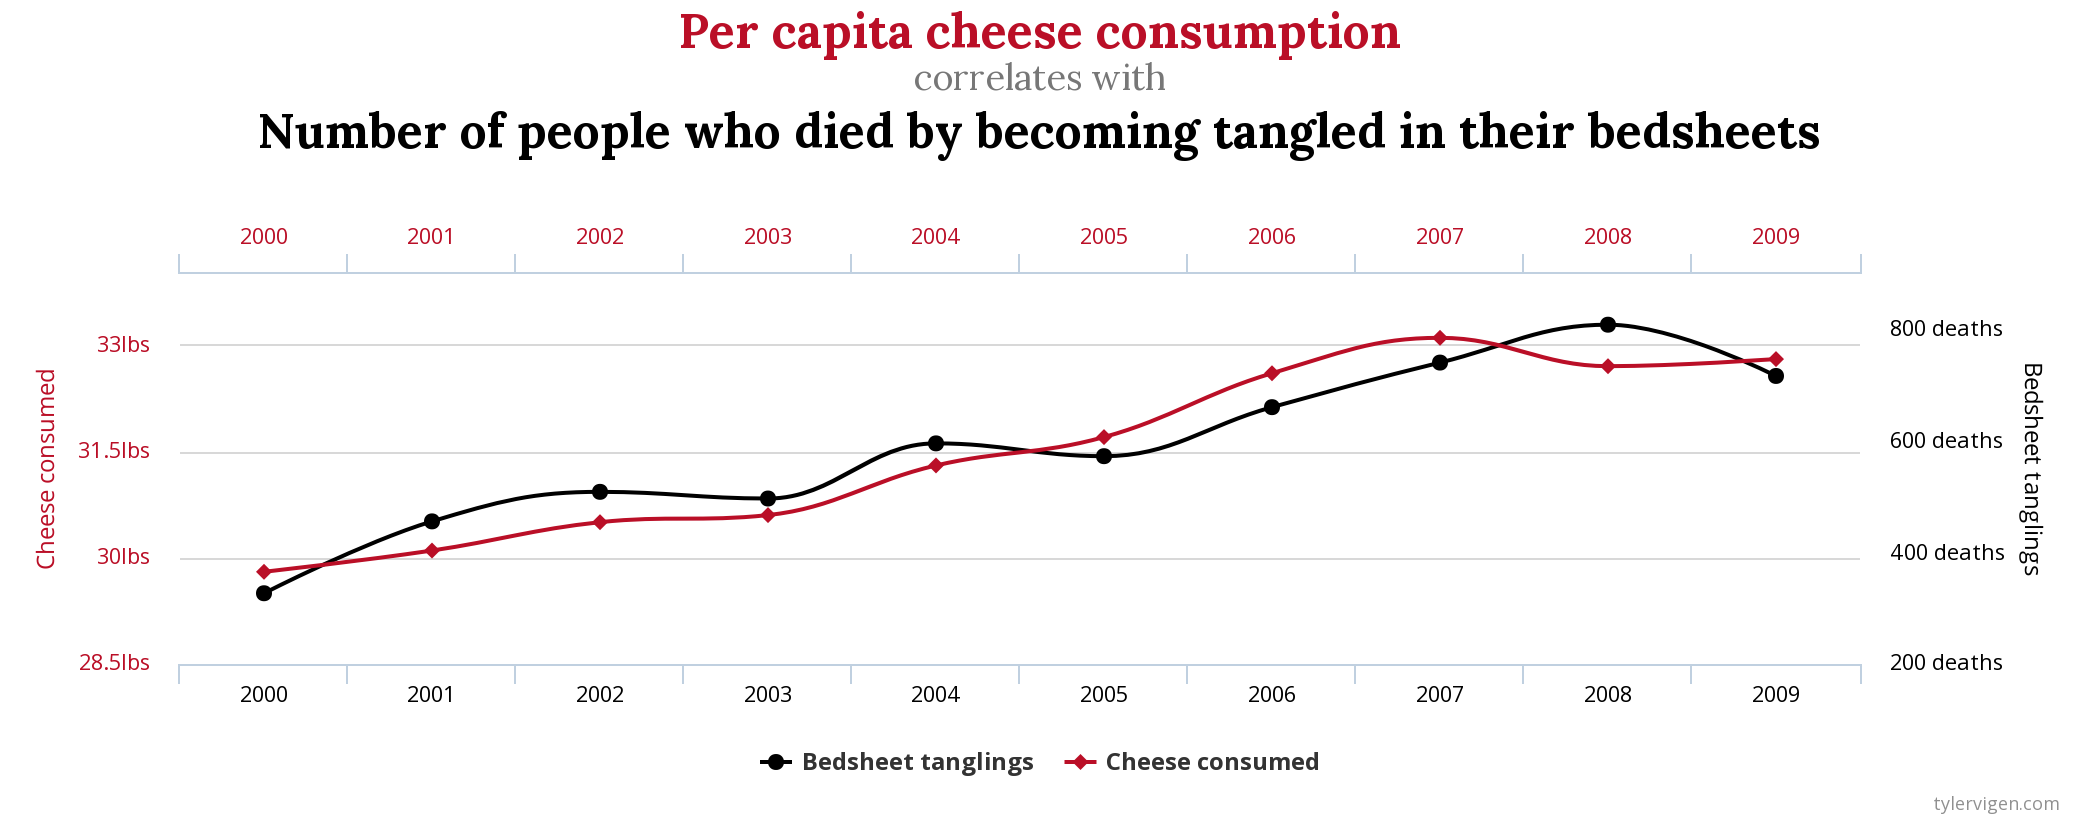
Hopefully the sarcasm is not lost but the data correlation above is accurate. In this case a reasonable person should assume these two events have very little to do with each other and certainly not a “Thing A causing Thing B” situation.
Now imagine a complex topic you’ve read up on. Was the “source of truth” aiming to provide an accurate description of the topic or was it simplified to match the author’s narrative? Remember that statistical tools can be very powerful story telling instruments.
Not all stories though are true.
Let’s Get Visual!
One of the most creative parts of data story telling is creating a visual pathway to education and learning. Tables work for some but others are more empowered with powerful visuals. Lines, bars, columns, and more convey context and direction in ways a limited amount of words can not.
This past week I’ve been reviewing a lot of visual styles that creators out there use to convey ideas. It is an amazing intersection of DataScience, Marketing, and Sales.
As the newsletter continues to develop, certain themes are becoming more important…
Growth
Momentum
Inflection

From a site called RocketSource, the slow ramp between start and growth speaks volumes.
A second visual that conveys so much information in an amazing minimal format.

Inflection. Momentum. How many things do we do in our life where we stop at “This is pointless”. This visual was created by Jack Butcher & Visualize Value.
PSA to PSA
In last week’s newsletter we discussed several topics about GameStop and market craziness. The PSA described Robinhood’s shenanigans in restricting the ability to purchase certain stocks. The driving thought at the time was that this may have been due to some investor pressure.
As this story continues to evolve there is currently discussion about an issue with Robinhood being able to cover the purchasing of GameStop stock and other specific assets. This is becoming the de facto Robinhood stance as it distances itself from the notion that it doesn’t support its app users.
In other news, here is a video of the CEO of Robinhood stating explicitly that this was not a liquidity issue. Sooo…. there’s that.
The World of AI
This week delivered an excellent article in my email on DropBox’s use of machine learning (ML) in their document management. Dropbox is known for doing some great things with ML but the article this week provided some insight into how
Dropbox is able to provide quick previews of petabytes of files every day for Dropbox’s consumers without downloading the file itself. The ML model actively works to identify which files are most likely to be opened by a user and controls the flow of files going into the “pre-warming” processor which preps files for quick review.
What makes this little bit of ML wizardry so impactful is that by NOT pre-processing all of a user’s files for preview, Dropbox is able to reduce the processor and ram usage by fractions of a penny. But add up those fractions of pennies across Dropbox’s millions of users and BLAM! 1.7 Million dollars saved per year.
Yes, very similar to Superman 3…
Photo of the Week

Dez Blanchfield, Founder & CEO - Sociaall Inc. @dez_blanchfield
I shot this amazing image on Sunday 31st January, 2021 in the evening walking around the city in the rain, I love how my city looks when it’s wet - this shot was taken on a walkway right on the waterfront of Sydney harbor, in an area called Circular Quay, just as the sun was setting and the final rays of light were touching the sails of the Sydney Opera House, washing it in that glorious magic photographers call the 'Golden Hour'. Just as I was about to take the shot, the Opera House building lights came on, adding to the ‘light show’ of sunlight and electric light reflecting off the sea water. I’ve always loved this location & view of the Opera House, it makes me feel like it is ‘floating’ like some sort of magical thing out of a B-Grade science fiction movie..” ( note: I shot it on a Panasonic GH5, with a Leica 12-60mm lens, no filters, no photo-shopping, this is RAW right out of the camera “as it was”, shot hand held, which thanks to the GH5’s in-body and Leica in-lens ’stabilization’ I got a rock solid clear image at a low ISO, slow shutter speed & small aperture ).
I’m so excited Dez was willing to share one of his images with us! Dez is an awesome resource on Twitter, posts about a wide array of topics in technology and data science. Several weeks ago, Dez posted some photography shots and we got to chatting. Definitely check out Dez on Twitter.
TwitterPool
This week in the TwitterPool I have less of a cesspool-esque story and more of a “seeing this more and more” story.
Scrolling through my feed several days ago, I came upon a posting by a young developer. She had taken screen shots of a very nicely worded form letter. The letter indicated that the job she had applied for, the organization did not feel she was a fit.
This was positioned side by side with a copy of the email she had sent back. “Rejecting their rejection!” she wrote. Explaining that the hiring contact back had no right to judge her without an interview and that her non-traditional training could be an asset.
Frankly, it read a bit snarky. Her idea that a business can’t be qualified to assess talent without an interview was most surprising.
While several users had written words of encouragement, sticking it “to the man”, I responded with: “Hold nn, I do hiring for technology positions. Is there really an expectation that I should give every single person who applies an interview?”
While she was more than happy to send likes at those who defended her “slay queen” attitude, she never responded the question.
Here I am, asking a legitimate question, yet the most she can muster are “hearts” to those who blindly support her poor professional behavior???
Unfortunately this is a growing trend; brazen statements meant to generate adoration. Yet when the opportunity presents itself to have a quality conversation… crickets. I followed up twice more asking for context and offering to review. Still nothing.
Takeaway: Step out of your echo chamber and have some good conversations. They might be uncomfortable but they are well worth it!
Quote of the Week
“Did you ever stop to think, and forget to start again?”
— Winnie the Pooh
Man, time sure does fly when we’re having fun. Like the blink of an eye this week’s newsletter is “fin”. It seems like the new format is definitely a hit. Longer form content will be moving to yourdatastory.io in the coming weeks. Until then, if you are new to Am I or Are The Other’s Crazy, thanks for reading! Feel free to checkout the archive.
As always, if you think someone would enjoy reading, please feel free to share the love.
Or, if you just can’t get enough, feel free to subscribe.
Looking for more, excited to support this endeavor? Feel free to follow me on Twitter or Instagram. Check out Your Data Story as well for more data science content!
@JWilcoxData
IG: JasonWilcoxPhotography
Dianoiarrhea, I like it! It could also translate into “Thinking out of your ass again” right ?